Top-50-Amazon-Books
Project Overview
- Genre Comparison, Fiction vs No Fiction, Top 10
- Dataset taken from https://www.kaggle.com/
- Tools: Google Sheets, Google Slides, Tableau
Process Phase
The data show the best sellers over eleven years. You can see the raw data in this Link
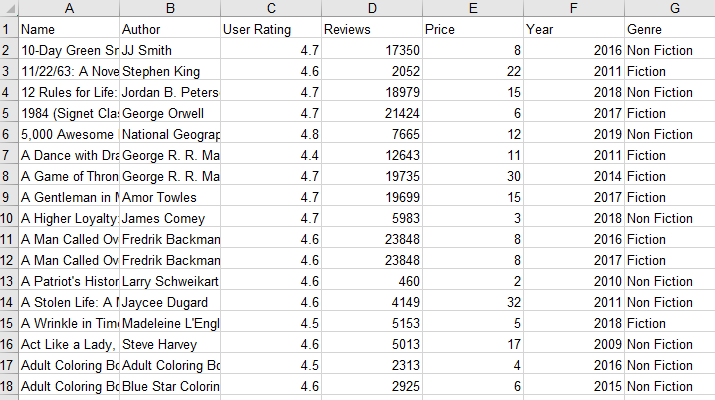
To clean the data I follow the steps from the Cleaning Log and all changes which I make during the Process and Analysis Phases I record them in the Change Log
Analyze Phase
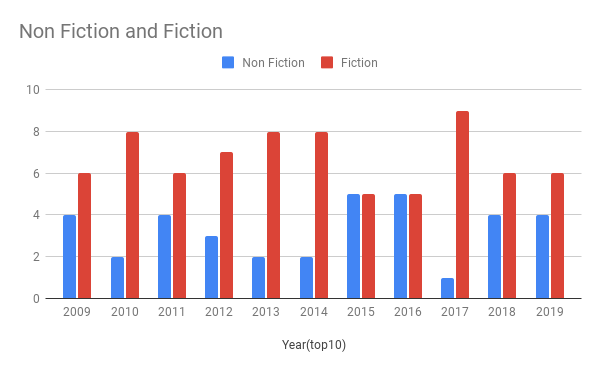
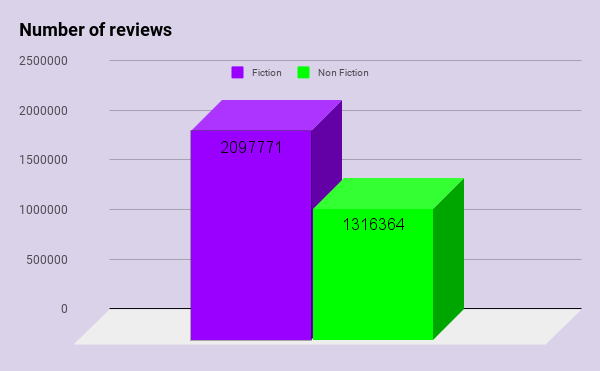
To analyze the data I used my Analysis Log to help me out. Used some basic functions, pivot tables and charts. Check the Bestsellers_No Duplicates to see the spreadsheet if you please. Here’s some charts.
1) Top10 , Fiction vs Non Fiction
2) Number of Reviews
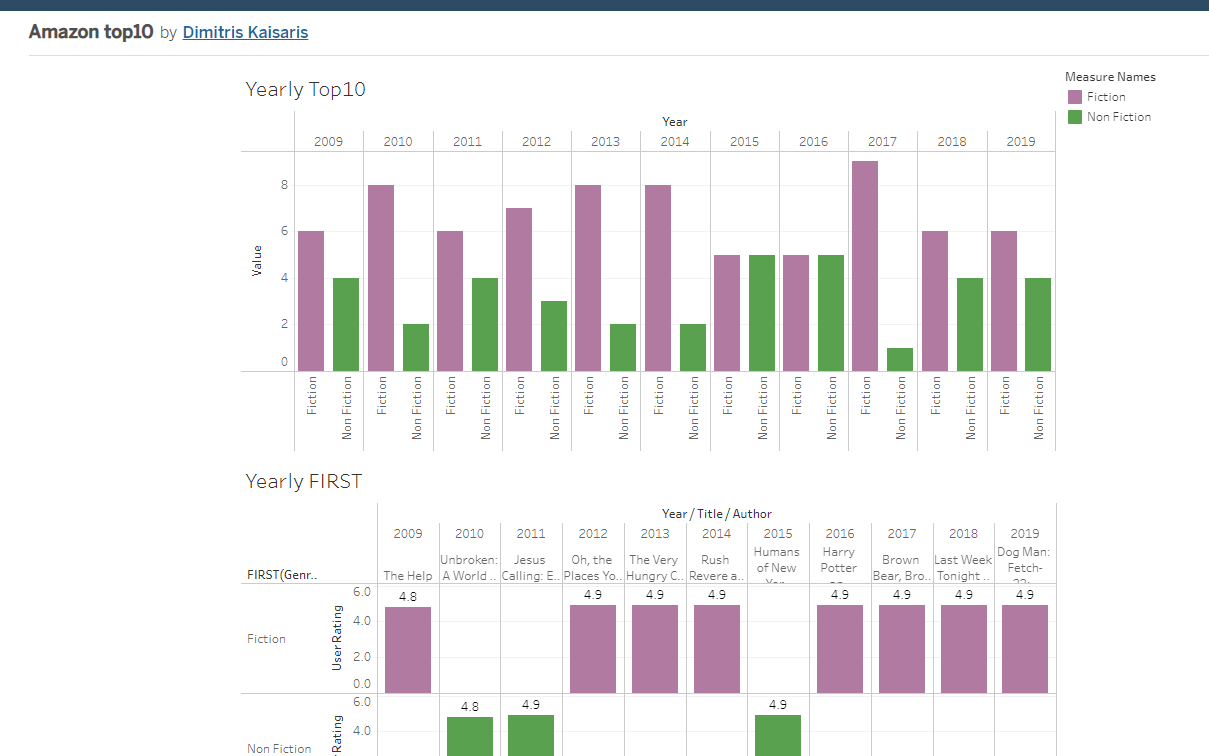
Share Phase
To share the findings I used my Share Log and created a Presentation and a dashboard in tableau , use Link